Instagram Insights in 2026: what each metric means and how to read your numbers
In this article, you will learn what Instagram Insights is and who can see it; how to open it on your phone and computer; what each metric means, from views to accounts engaged; what sharing and forwarding mean on a story; how to calculate your engagement rate; and which metric to watch for each goal.

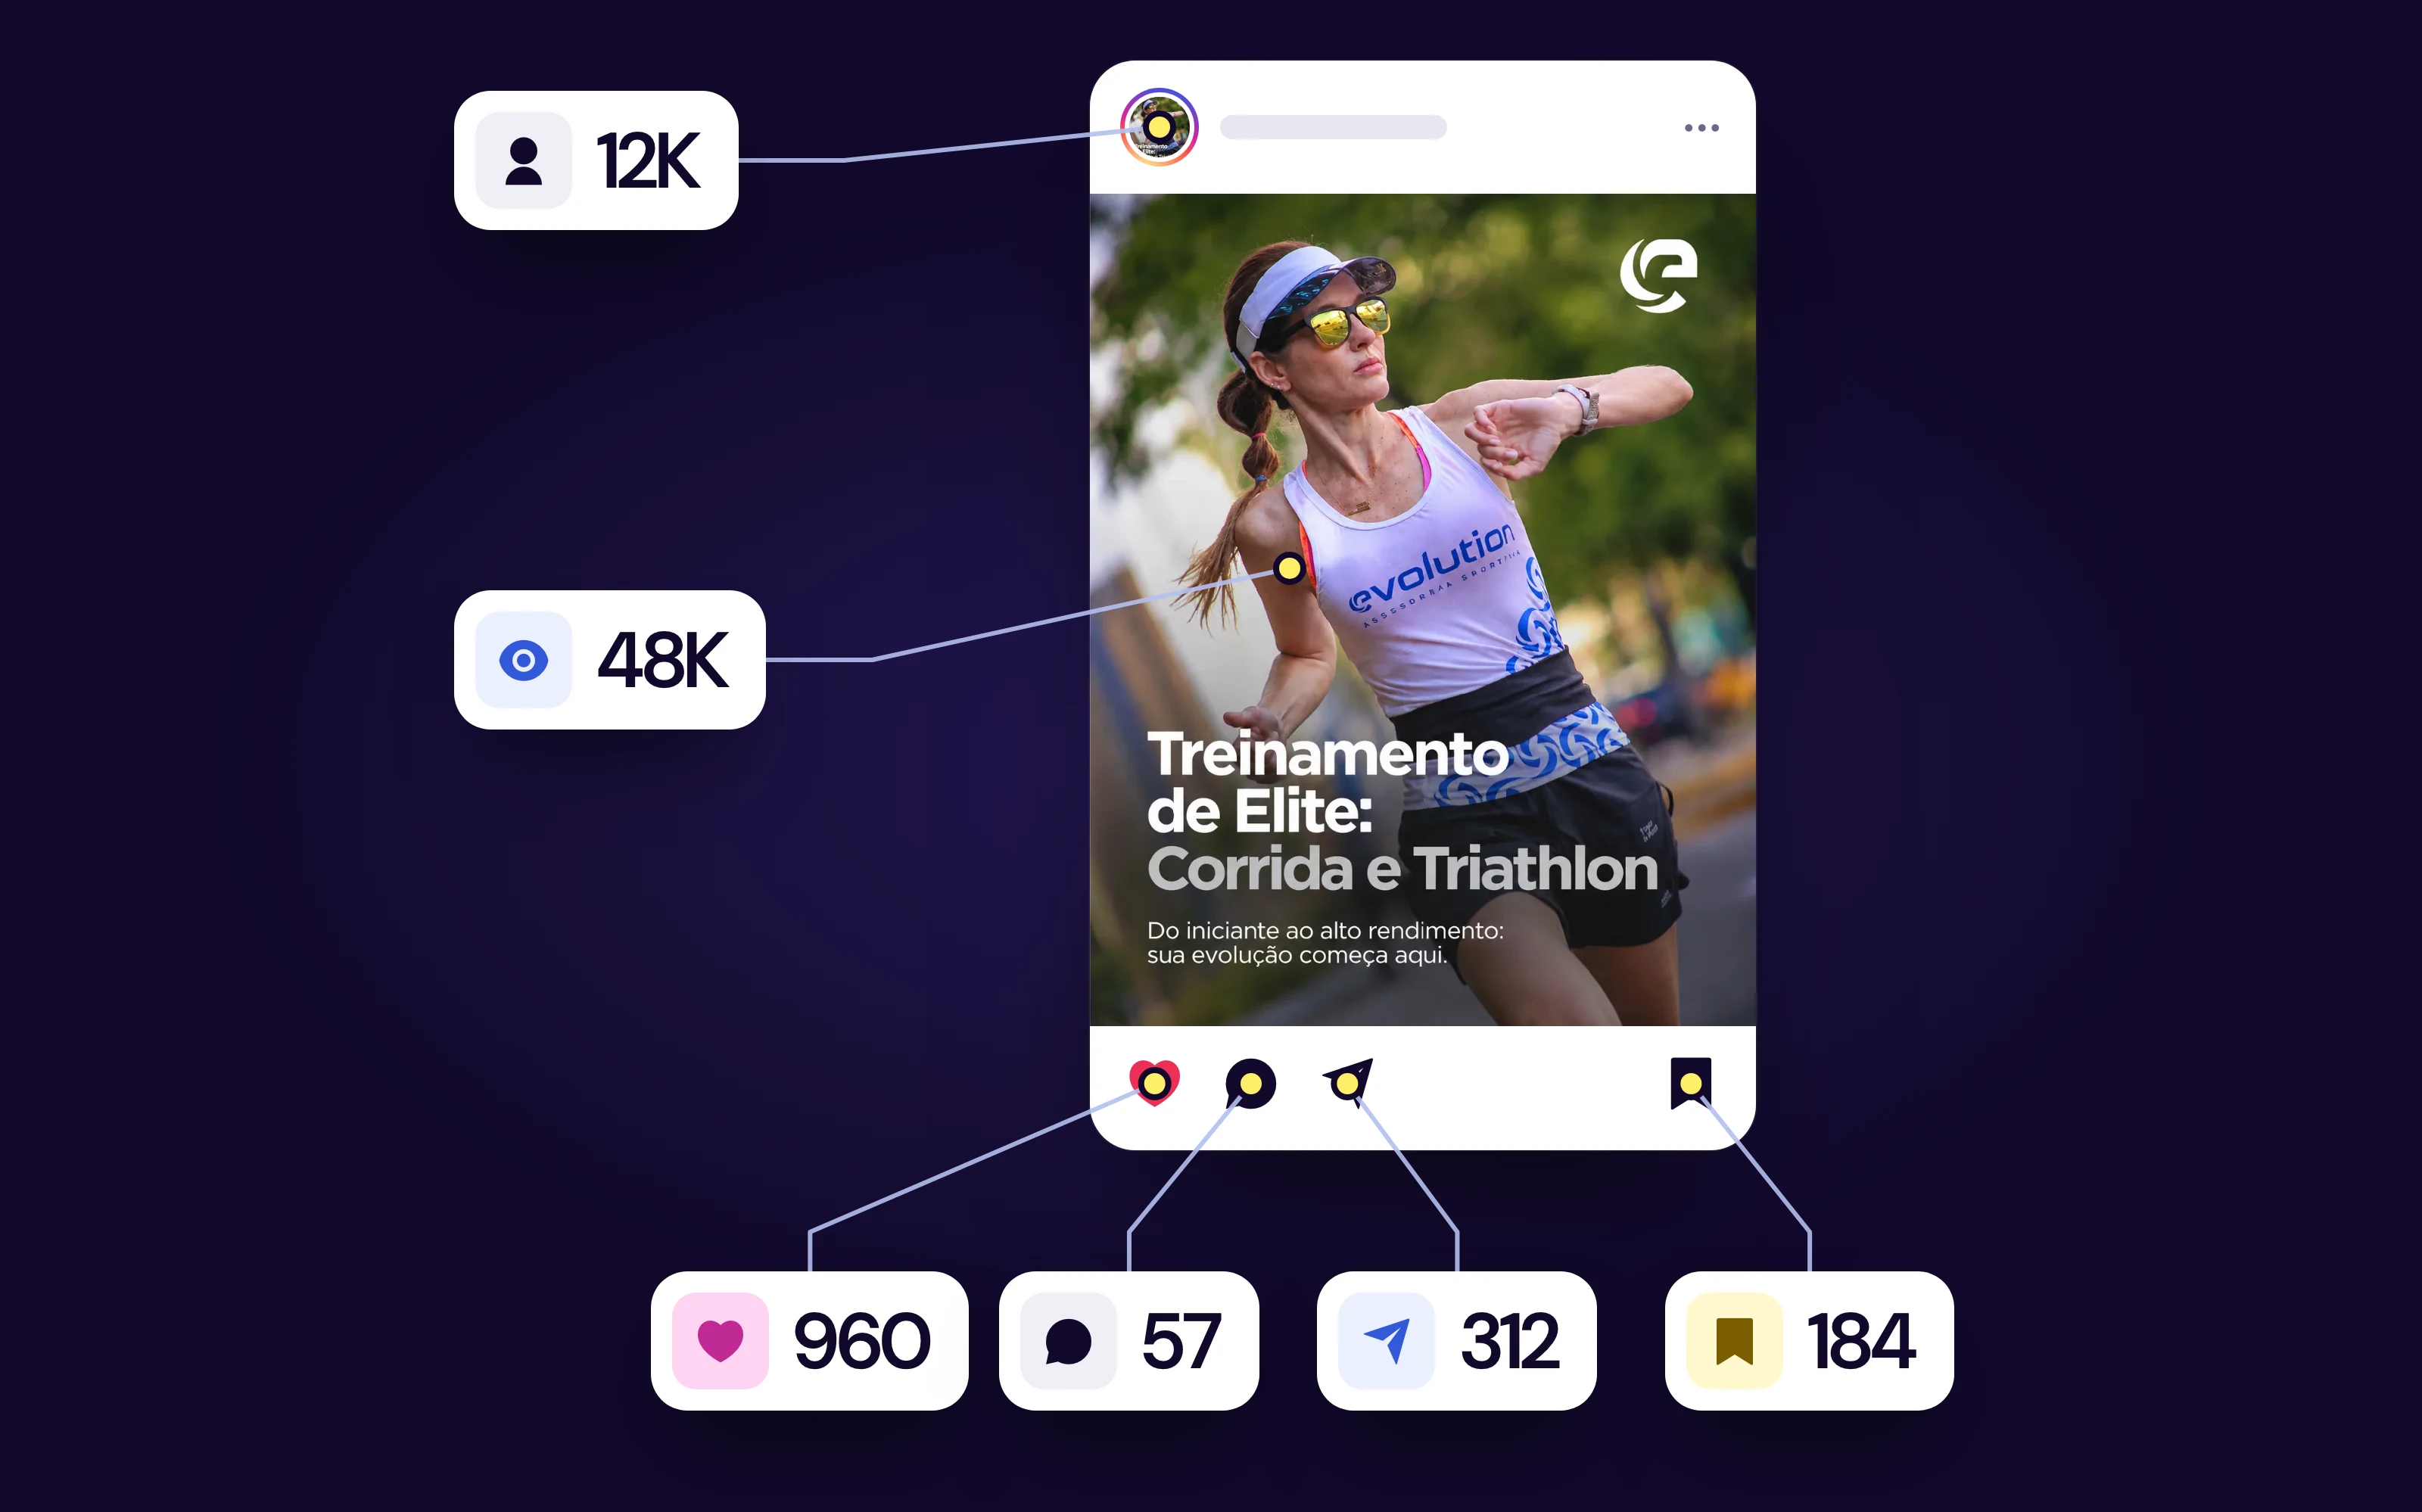
Instagram Insights is the metrics dashboard that shows how many times your content was seen (views), how many different people saw it (viewers), what they did with it (interactions) and who your audience is. It is free, works for any public account and keeps your account data for the last 90 days.
| Metric | What it measures | When to look at it |
|---|---|---|
| Views | Times the content was shown or played, counting repeats | To know whether the post traveled |
| Viewers (accounts reached) | Different people who saw the content at least once | To know how many new people you reached |
| Interactions | Likes, comments, saves and shares added together | To know whether the content made people act |
| Accounts engaged | Different people who interacted, split between followers and non-followers | To know who is reacting |
| Shares | Times someone sent your content to another person or to their own story | To measure what is worth recommending |
| Saves | Times someone kept the post to see later | To measure useful content |
| Profile activity | Profile visits, new followers and website taps that came from the content | To measure whether the post leads to your business |
| Total followers | Gains and losses, location, age and most active times | To know your audience and plan |
The table sums up the main Instagram metrics. The rest of this guide explains each number, shows where it lives in the app and, above all, what to do when it goes up or down.
What changed: Meta replaced "impressions" and "plays" with views, a single metric for every format, as it explained in its official announcement for creators. In April 2026, Insights also got new tabs and share and skip rates on posts and Reels, according to Social Media Today. Many guides still teach "impressions", which no longer shows up for photos, carousels and Stories.
In this guide, you will learn:
- What Instagram Insights is, who can see it and how to open it on your phone and computer.
- What each Instagram metric means, with the official definition and the trap in each one.
- What sharing and forwarding mean, the two terms that cause the most confusion.
- How to calculate your engagement rate and which number to use as a benchmark.
- Which metric to watch for each goal and what to do when it drops.

What is Instagram Insights and who can see it?
People who search for "instagram insights" usually want two answers: where the numbers are and what each one means.
Instagram Insights is the app's built-in metrics area. According to the Meta Business Help Center, any public account gets free access to insights for the account and for every post, Reel, story and live video. You don't need to pay or install anything.
Do you need a professional account?
To see the metrics, no. The Help Center itself says a public account is enough, personal or professional. A professional account (business or creator) is required to boost posts and for business features such as contact buttons. For a brand, switching to a professional account is still worth it, but that is not what unlocks Insights.
Watch out: if the account goes back to private, you lose access to insights. According to the Instagram Help Center, the old data comes back if the account turns public again within 90 days. An account that only recently became public may not see earlier history.
How long is the data kept?
There are two different windows, and this is where many people get confused:
- Account insights (the overall dashboard): periods of 7, 14, 30 or 90 days, or a custom range within the last 90 days.
- Insights for each piece of content: Reels and Stories show their numbers for up to two years after publishing, even after the story has expired.
In practice, the overall dashboard doesn't go back further than 90 days. To compare a whole year, write down or export the numbers every quarter.
How do you see Instagram Insights on your phone and computer?
The path changes a little depending on what you want to see: the whole account or a specific post.
Account insights, on your phone
- Open your profile in the app.
- Tap Professional dashboard or View insights, just below your bio.
- Pick the period in the menu at the top.
- Tap each block (Views, Interactions, New followers, Content you shared) to open the details.
Tip: on each screen, tap the (i) in the top right corner. Instagram itself shows the definition of each metric there, under the exact name it has in your account.
Insights for a post, Reel or story
- Post and Reel: open the content and tap View insights, just below the image or video.
- Live story: open the story and swipe up, or tap More and then View insights.
- Older story: go to View insights on your profile and find the story under Top content.
On a computer
On instagram.com, click Dashboard in the left menu, then Insights (professional account) or Your dashboard (personal account), and choose Account or Content. The bigger screen makes it easier to compare several posts side by side.

What do the Instagram metrics in Insights mean?
Instagram metrics fall into four groups: those that measure how far the content traveled, those that measure what people did, those that measure the effect on your profile and those that describe your audience. Below is each one, with the official definition and what to watch for when reading it.
Views
This is the number of times your content was played or shown. For video, it counts each time the Reel starts playing or replays. For photos, carousels and stories, it counts each time the content appears on screen, including for the same person.
When it helps: it is the fastest gauge of distribution. If a post's views are well above your average, Instagram is showing that content to more people.
Watch out: a view is not a person. Meta gives the example of someone who sees the same photo three times in one day: that is three views. That is why the number tends to be higher than the old impressions, and comparing today's views with 2024 impressions skews the reading.
Viewers (accounts reached)
This is the number of unique accounts that saw the content on screen at least once. Some places in the app still call it "accounts reached". It is what marketers call reach.
When it helps: it answers the question "how many people did I reach?". Also look at the split between followers and non-followers: it shows whether the content is reaching new people.
Watch out: Meta warns that this number is estimated and still in development. Use it to compare posts with each other, not as an exact count.

Interactions
This is the sum of the actions people take on the content: likes, comments, saves and shares. On Stories, it also includes replies, sticker taps and link taps.
When it helps: it shows whether the content got any reaction beyond being seen.
Watch out: not every interaction is worth the same. A like costs one tap; saving and sharing show the person found the post useful or good enough to recommend. Open the details and look at each type separately.
Accounts engaged
This is the number of different people who interacted, split between followers and non-followers. One person who likes, comments and saves counts as three interactions but one account engaged.
When it helps: it tells you whether the reaction comes from many people or from a small, very active group. For a local business, a few loyal engaged accounts can be worth more than lots of scattered likes.
Saves and shares
A save is when someone keeps the post to see later. A share is when someone sends the content in a message or puts it in their own story. These are the two numbers that say the most about the quality of the content, because they require a decision from the person.
Carousels with step-by-step guides, lists and checklists tend to get saved; funny or controversial content tends to get shared. If you want to know which format works best for saves, see our guide to the Instagram carousel.
Profile activity
This groups what people did on your profile after seeing the content: profile visits, new followers and taps on your website or bio links.
When it helps: it is the bridge between the post and the business. A post with average reach and lots of profile visits can be worth more than a viral post nobody clicked on.
Total followers
This shows how many followers you gained and lost in the period, where they are from, their age range and their most active times. This data appears once the account passes 100 followers, and the demographics section needs at least 100 accounts reached or engaged.
Most active times are the basis for choosing when to post. In our guide to the best time to post on Instagram, we show how to read this data and test your own time over four weeks.
Content you shared
This block doesn't measure your audience: it is only the count of stories, Reels and posts that you published in the period. It helps you match volume against results. If views dropped in the month you posted half as much as usual, the drop may come from volume, not from the content.
What are the metrics for Reels, Stories and carousels?
The basics are the same in every format, but each one has its own numbers. It is worth looking at what is specific to each.
Reels
- Watch time: the total time the Reel was played, including replays.
- Average watch time: watch time divided by initial views. Compare it with the video's length to see how far people watch.
- Skip rate: according to Meta's official developer blog, it is the percentage of views in which the person skips the Reel within the first 3 seconds. A high rate means the opening didn't hold attention.
- New followers: how many accounts started following you because of that Reel.
If the skip rate is high, the problem is almost always in the first frame and the first sentence, not in the whole video. If the video is long, average watch time matters even more: our article on Reels up to 90 minutes long explains when it is worth going past one minute.
Stories
On Stories, besides views and viewers, you see interactions (replies, shares, sticker taps and link taps) and profile activity. There are also navigation numbers, which show what the person did while going through your story: move forward to the next one, go back, exit or skip to another account's story.
How to read it: lots of people moving forward or exiting on a specific story shows where the sequence lost interest. Lots of people going back is usually a good sign: they wanted to see it again.
Carousels and photos
Carousels and photos use the same set: views, viewers, interactions and profile activity. On a carousel, each time the person comes back to the post counts as a new view, so the number tends to be higher than reach. If you still have questions about format and aspect ratio, see our guide to Instagram post size.
What does sharing mean on Instagram, and what is forwarding on a story?
These two terms account for a good share of the questions, because the same word shows up in different parts of the app with different meanings.
"Shares" vs. "Content you shared"
- Shares is an audience metric: how many times someone sent your post, Reel or story to another person in a message, or to their own story.
- Content you shared is a count of your own activity: how many posts, Reels and stories you published in the period.
If you saw "shared" in the account overview, it is probably the second one. If you saw it inside a post, it is the first. Reposting someone else's story is a different topic, which we explain in how to repost stories on Instagram.
"Forward" has two meanings
In guides and in everyday use, "forward" shows up with two meanings: sometimes sending the story to someone in a message, sometimes tapping forward to the next story. In Meta's official metrics documentation, these are two separate measurements: shares on one side, navigation (forward, back, exit) on the other.
The safe way to know which one applies to your account is to tap the (i) on the story insights screen. The definition shown there is the one that applies to the number you are looking at.

What is a reshare on an Instagram story?
When someone else puts your post in their story or reposts your content, the reach that comes from it is added to your views. Since December 2025, Meta has also counted how many times each piece of content was reposted, according to the same developer blog. The names in the app still vary from account to account, so check the (i).
What is engagement on Instagram and how do you calculate the rate?
If you searched for Instagram engagement or how to see engagement on Instagram, the short answer is: the raw numbers are in Interactions and Accounts engaged, inside Insights, and you calculate the rate yourself.
Engagement is how much people react to your content. The engagement rate turns that into a percentage, so you can compare posts and periods of different sizes. Instagram shows the interactions, but the rate is a calculation you do.
The three most common formulas
- By reach: interactions ÷ viewers × 100. It measures the reaction of the people who actually saw the post. It is the fairest way to compare posts with each other.
- By followers: interactions ÷ total followers × 100. It is the one industry reports use, because it can be calculated from other brands' public profiles.
- By views: interactions ÷ views × 100. Useful for Reels, but it pulls the rate down when people watch more than once.
An example with the same numbers
A post got 120 interactions, 2,000 viewers and 3,000 views, on an account with 5,000 followers:
- By reach: 120 ÷ 2,000 = 6%
- By followers: 120 ÷ 5,000 = 2.4%
- By views: 120 ÷ 3,000 = 4%
The post is the same; only the yardstick changed. That is why the most important rule is to pick one formula and always use the same one. To track your own profile, the reach formula is the most useful. To compare yourself with the market, use the followers formula.

What is a good engagement rate on Instagram?
There is no official number. The most solid industry data we found is the 2026 annual social media industry benchmark report, which tracks 150 companies per industry: Instagram's median was 0.30% per post, counting interactions divided by followers, down from 0.36% the year before.
That number comes from brands, many with millions of followers, and large profiles tend to have lower rates. For a small or local profile, the most useful benchmark is your own: calculate the rate for your last 10 or 20 posts, take the middle value (the median) and use it as your baseline. A post above it worked; below it, it is worth understanding why.
For example, BestContent Social Analytics already shows each post's engagement percentage next to reach, likes, comments, shares and saves. It also exports everything to CSV or PDF, which helps you keep history beyond the native dashboard's 90 days.
Which Instagram metric should you watch for each goal?
Looking at every number every week is tiring and confusing. The most useful approach is to pick the metric that answers your current goal and use the others only to explain the result.
| Goal | Main metric | If it drops, check first |
|---|---|---|
| Get discovered by new people | Non-follower viewers | Reels skip rate and shares |
| Create content people save | Saves | Format (carousel, step by step) and how useful the topic is |
| Get the content to spread | Shares | Whether the post is easy to recommend to someone |
| Build a community | Comments and engaged follower accounts | Whether you are replying and starting conversations |
| Drive people to your business | Profile activity (visits and taps) | Call to action, bio and link |
| Grow your audience | New followers per post | Which Reels brought followers and what they have in common |
What to do when a metric drops
- Confirm it is a real drop. Compare it with your median, not with your best post.
- Separate volume from quality. Check "Content you shared" to see whether you posted less in the period.
- Find the breaking point. On Reels, skip rate and average watch time show where the video loses people. On Stories, navigation shows which story people left on.
- Change one thing at a time. If you change format, time and topic all at once, you won't find out what worked.
Why is Instagram Insights not showing up?
The most common causes have simple fixes:
- Private account: Insights only exists for public accounts. Once you make the account public, data starts being collected from that point on.
- Too few followers: audience data (age, city, active times) only appears with at least 100 followers or 100 accounts reached.
- Post too recent: the numbers don't settle right away. Wait at least a day before drawing conclusions.
- Period too long: the overall dashboard doesn't go past 90 days. For more, you have to export or write the numbers down.
- Formats outside the new screen: collab posts, trial Reels, content published on another network and boosted posts don't yet appear in the tabbed version launched in 2026.
- A different name from the one you are looking for: if you are looking for "impressions", look for "views".
What about metrics on other networks?
The logic repeats on other networks, with similar names:
- Facebook: uses the same views metric as Instagram, calculated the same way, according to Meta. The numbers are in Meta Business Suite and in the Page's professional dashboard.
- TikTok: the Analytics area shows each video's performance and your audience's most active times, according to TikTok's Creator Academy.
- YouTube: YouTube Analytics shows views, watch time and, in the Audience tab, when your viewers are on YouTube.
If you publish on several networks, your choice of engagement formula applies to all of them: use the same yardstick so you can compare. To see which networks your audience is on, our survey of the most used social networks in Brazil helps you decide where to focus.
Frequently asked questions about Instagram Insights
What is Instagram Insights?
Instagram Insights is the app's free metrics dashboard. It shows views, viewers, interactions, new followers and audience data for any public account, with up to 90 days of account history.
How do you turn on Instagram Insights?
There is nothing to turn on: the account just needs to be public. Open your profile and tap Professional dashboard or View insights. On each post or Reel, tap View insights below the content.
What is the difference between reach and views on Instagram?
Reach, which the app calls viewers or accounts reached, counts different people. Views count how many times the content appeared, including repeats by the same person. That is why views are usually higher than reach.
What does sharing mean on Instagram?
In a post's metrics, shares are the times someone sent your content in a message or to their own story. In the account overview, Content you shared is just the count of posts you published.
What is forwarding on an Instagram story?
The term is used in two ways: sending the story in a message or tapping forward to the next story. Meta measures these two things separately. Tap the information icon on the insights screen to see the definition that applies to your account.
How do you calculate the engagement rate on Instagram?
Divide the post's interactions (likes, comments, saves and shares) by its reach and multiply by 100. Dividing by followers is also common. Pick one formula and always use the same one to compare.
How can you see Insights for more than 90 days?
The overall account dashboard only shows the last 90 days. Reels and Stories keep the numbers for each piece of content for up to two years. To compare long periods, write down or export the data every quarter.
Conclusion: how to read your Insights every week
Instagram Insights answers four questions: how far the content traveled, what people did, whether it led them to your profile and who your audience is. Views and viewers measure reach; interactions, saves and shares measure reaction; profile activity measures the effect on your business.
To read your Instagram metrics, a 15-minute weekly routine is enough:
- Pick the main metric for this month's goal.
- Compare each post from the week with your median.
- Write down your best and worst post and what made each one different.
- Change one thing the following week and see whether the number follows.
- Every quarter, save your numbers, because the dashboard deletes anything older than 90 days.
This guide is by BestContent. To plan and publish your posts based on what the numbers show, check out the BestContent post scheduler, which helps you keep a consistent posting schedule.